

Measuring Tradeshow R.O.I!
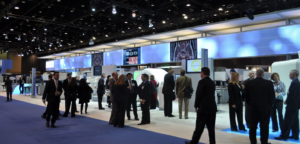
Tradeshows are about FaceTime– so HOW DO YOU MEASURE YOUR ROI?
 Do you know the return on investment of your last social media campaign? How about print media? While it’s easy to track the profitability of your on-line marketing efforts, accurately tracking your offline marketing ROI is a bit of a different challenge.
Nowhere is this truer than with tradeshows. Many businesses “think” that their trade show marketing is profitable, but ironically most don’t measure ROI of their trade show activities. The biggest reason for this lack of measurement is most businesses either don’t know where to start or don’t believe it can be done effectively.
Having attended or managed literally hundreds of tradeshows throughout my career, and knowing that an average company allocates 43% of marketing budgets/exhibit marketing, it is unreasonable for businesses not to track the ROI of this huge investment.
So how do you do it? Where do you start? In this article, I’ll guide you through a few simple steps that you can use to assess your next trade shows return on investment and profitability in both the short term and the long term.
Before your next exhibit, there are three key areas to focus on and track…Budget, Performance Goals, Financial Goals. To be successful in tracking ROI you must have all three.
What are your goals? There will be many! Is your goal to make sales at the event? Does the event allow for “on the floor” sales? Should you take inventory? Is this an “order writing” show or is this mainly a “lead gen” show? If you are taking orders, new deals will be a key metric, if your goal is to meet more people and generate leads, then it is important to count using names and phone numbers. You get the picture. Your goals will determine the methods used to measure ROI.
 I like to break the actual tradeshow metrics (after the budget is allocated) into two types of metrics. Performance Metrics and Financial Metrics. This allows for quickly seeing what worked, how effectively, and what needs to be adjusted for better performance. Let’s quickly break down the top 10.
- Exhibit Interaction Capacity/Utilization
- Exhibit Attraction Efficiency
- Staff Interaction Rate
- Cost per Interaction (CPI)
- Cost per Lead(CPL)
- Cost per Sales Order (CPSO)
- Lead Quality and Quantity
- Potential Value of Leads Captured
- Hard Dollar ROI: at and post-show sales
- Soft Dollar ROI
An entire article could be dedicated to each of these metrics. The first 3 are considered performance metrics, the final 7 financial metrics. Once you have established your goals for each of these metrics, you can effectively calculate the performance of the show and the ROI.
Exhibit Interaction Capacity/Utilization: This is calculated by taking the Exhibiting Hours multiplied by the full-time exhibit staff. For example, if the show floor is open for 30 hours and you take two full-time staff members, this equals 60 total staff hours available. Now simply set your interaction goals—let’s say 3-5 interactions per hour and multiply. (3 is conservative 5 is aggressive) This gives you 180-300 Exhibit Interaction Capacity. To measure your effectiveness, simply take the actual number of exhibit interactions divided by the exhibit interaction capacity. This gives you your Exhibit Capacity Utilization. Your target/goal should be 80-100% Utilization.
Exhibit Attraction Efficiency: This is calculated by taking the actual number of Exhibit Interactions and dividing it by the profile matches in the show audience. (You should have a pre-show list that allows you to determine the number of profile matches in attendance. This is typically broken down by Business Type-Job Function/Title and Geography) A good benchmark for this is 45%.
Staff Interaction Rate: This is calculated by taking the number of visitors physically engaged by staffers and dividing this by the total of booth visitors. The target for this metric should be 100%. We don’t want any visitor to leave the booth without being engaged! With technology being what it is today, companies are using GoPro® type devices to record the show. This provides for a great team review.
Financial Metrics are Easily calculated.
CPI=Total Show Investment (Actual Expenditures) divided by total Exhibit interactions.
CPL= Total Show Investment (Actual Expenditures) divided by total leads captured
CPSO= Total Show Investment (Actual Expenditures) divided by total number of orders
Lead Goals, Quantity and Quality= Lead Goal divided by total leads captured. (It is very important that you have a “legend” for all the leads captured, no matter what type of lead capture tool you are using. This allows you to rank the leads AND direct the follow-up activities. For those shows where you are just collecting business cards, create a legend of shortcodes to write on cards that every staffer knows and uses. Examples could include: IO=internet only. RS-12=Twelve Retail stores, KD=key decision maker, F1, F2, F3 are your follow-up actions. F1=email, F2=samples, F3=website copy and images. Whatever you want them to be, but use them!)
Potential Value of Leads: This metric is very important. Calculate this by taking the total number of leads multiplied by the Average Sales Amount. Divide this by the total show investment to get your Soft Dollar ROI. It is important to remember that the orders you received at the show are the “low hanging fruit” or the tip of the iceberg if you will. The leads generated are typically where the big money will come from. This is one reason it is important to track the CPI (cost per interaction) and the CPL (cost per lead). We always want to track the value of the customer for the next year and the Lifetime Value of the customer.
 Return and Report
Time and again companies return from their exhibits and focus only on the “next” big project to accomplish. This is so non-productive! Just as with on-line marketing you must run, analyze, adjust, and perfect. You cannot do this without the returning and reporting. Sections to include in your Exhibiting Performance and ROI Report should include:
- General Show Information
- Exhibiting Objectives Set and Progress made Toward these objectives
- Exhibit Interaction Capacity/Utilization – Cost Per Interaction
- Leads: Goal/Actual, Cost Per Lead, Potential Value of Leads
- Pre & At-Show Marketing: Media, Reach/Response and Effectiveness
- Public Relations and Media Exposure
- Booth/Exhibit Design and Effectiveness
- Demonstrations/Presentations
- Hospitality and Sponsored Events (if any)
- Key Customers and VIPs Met
- Competitive Summary
- Show Budget vs Actual w/Benchmarks and R.O.I.
- Lessons Learned & Recommendations for Next Show
Conclusion:
As you can see, with a little planning, and tracking you can effectively measure the ROI of your trade shows. As we all know, every trade show is different. Even the same event can vary hugely in performance from one year to the next. This makes measuring your ROI for every show even more essential.
The best marketers are constantly improving their metrics and tracking their trade show ROI. Let your past statistics guide your strategy, but never stop measuring the profits you generate from each trade show or event individually.
I am curious to know… how profitable was your last trade show event? Are you measuring your ROI effectively? What tools do you use to do this? I’d love to hear what you think and what is making you effective!